Loading...
Loading...
Loading...
Loading...
Loading...
Loading...
Loading...
Loading...
Loading...
Loading...
Loading...
Loading...
Loading...
Loading...
Loading...
Loading...
Loading...
Loading...
Loading...
Loading...
Loading...
Loading...
Loading...
Maitre'D profit per item by Revenue Center report shows sales item profit information by Revenue Center for the date or the period of time requested. From the report filter window, select the appropriate dates, Revenue Centers and divisions to be included in the report.
The following is a sample of the profit per item by Revenue Center report:
For each Revenue Center, this report is divided in two sections. The first section provides you with:
Item Description
Description of sales item.
Item
Code of sales item in P.O.S. Control.
Quantity
Quantity of sales item sold, by sales item and total for the Revenue Center.
Price
Sales price of a single sales item.
Sales
Quantity of sales item multiplied by price of single sales item, for sales item and total for the Revenue Center.
Sales%
Percentage of total sales of this sales item compared to all sales of this Revenue Center.
Unit Cost
Cost of single sales item.
Cost
Quantity of sales item multiplied by unit cost of single sales item, and total for the Revenue Center.
Cost%
Percentage of total cost of sales item compared to total sales of sales item, and total for the Revenue Center.
Profit
Total sales of sales items minus total cost of sales items, and total for the Revenue Center.
For each division category, the second section provides you with:
Division Category Description
Description of category.
Sales
Total sales of category, and total of all categories
Cost
Total cost of category, and total for all categories
Cost%
Percentage of total cost of category compared to total sales in category, and total for all categories.
Profit
Total sales of category minus total cost of category, and total for all categories.
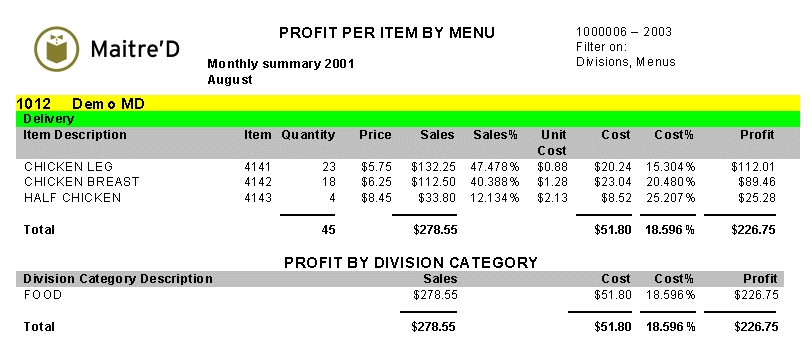
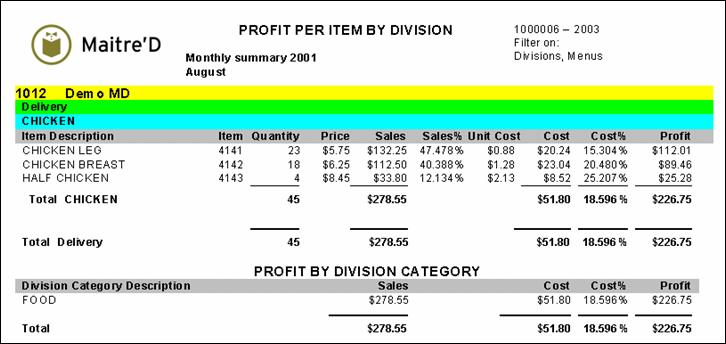
Maitre'D profit per item by division report shows sales item profit information by division for the date or the period of time requested. From the report filter window, select the appropriate dates, Revenue Centers and divisions to be included in the report.
The following is a sample of the profit per item by division report:
For each Revenue Center, this report is divided in two sections. For each division, the first section provides you with:
Item Description
Description of sales item.
Item
Code of sales item in P.O.S. Control.
Quantity
Quantity of sales item sold, by sales item and total for the division.
Price
Sales price of a single sales item.
Sales
Quantity of sales item multiplied by price of single sales item, for sales item and total for the division.
Sales%
Percentage of total sales of this sales item compared to all sales of this division.
Unit Cost
Cost of single sales item.
Cost
Quantity of sales item multiplied by unit cost of single sales item, and total for the division.
Cost%
Percentage of total cost of sales item compared to total sales of sales item, and total for the division.
Profit
Total sales of sales items minus total cost of sales items, and total for the division.
For each division category, the second section provides you with:
Division Category Description
Description of category.
Sales
Total sales of category, and total of all categories
Cost
Total cost of category, and total for all categories
Cost%
Percentage of total cost of category compared to total sales in category, and total for all categories.
Profit
Total sales of category minus total cost of category, and total for all categories.
Maitre'D Divisions comparison by Revenue Center report compares division gross sales by category for each Revenue Center. The graphic shows you the gross sales variation for the 2 dates or the 2 dates range period selected. From a report filter window, you select the appropriate dates or date range, the appropriate comparison date or date range, category, division, Revenue Center and mode for the information needed. The following is a sample of the Division comparison by Revenue Center report:
You get a detailed list of all the information shown on the graphic for the 2 dates or the 2 period of time selected. The divisions are sorted in the order you programmed them in the Maitre'D Back-Office. The first set of columns shows information on the fiscal date and the second set of columns shows information on the comparison date.
For each division find:
Quantity:
Quantity of item sold belonging to the division (applies to the fiscal and comparison date)
Amount:
Division gross sales (applies to the fiscal and comparison date)
Variation:
Comparison date $ amount LESS fiscal date $ amount
Variation%:
Variation divided by the $ amount (from the fiscal date) multiply by 100
Take note: a total quantity, $ amount, variation and variation % shows up at the top of the graphic. This total includes all divisions belonging to the category.
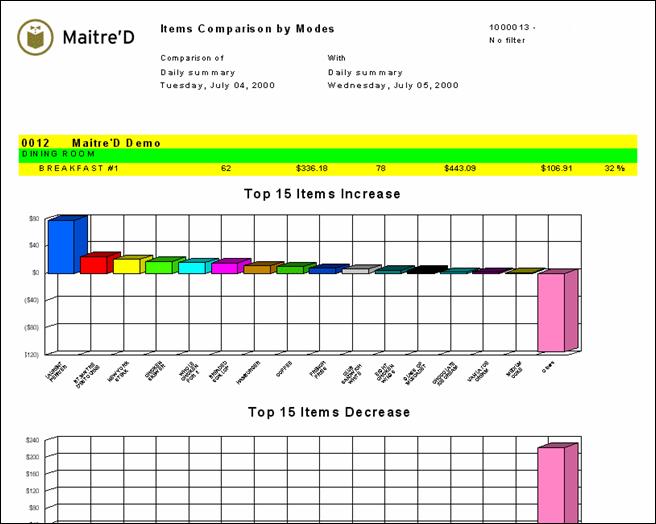
Maitre'D Items comparison by modes report compares item gross sales by category and mode for each Revenue Center. The graphic shows you the gross sales variation for the 2 selected date or the 2 dates range period. The graphic is divided in 2 sections: top 15 items increase and top 15 items decrease. One section provides you with 15 items that had the highest increase in variation and the second one provides you with 15 items that had the most decrease in variation. From a report filter window, you select the appropriate dates or date range, the appropriate comparison date or date range, category, division, Revenue Center and mode for the information needed. The following is a sample of the items comparison by mode report:
You get a detailed list of all the information shown on the graphic for the 2 dates or the 2 period of time selected. The items are sorted in numerical and alphabetical order. The item # precedes each item. The first set of columns shows information on the fiscal date and the second set of columns shows information on the comparison date.
For each item find:
Quantity
Quantity of item sold (applies to the fiscal and comparison date)
Amount:
Item gross sales (applies to the fiscal and comparison date)
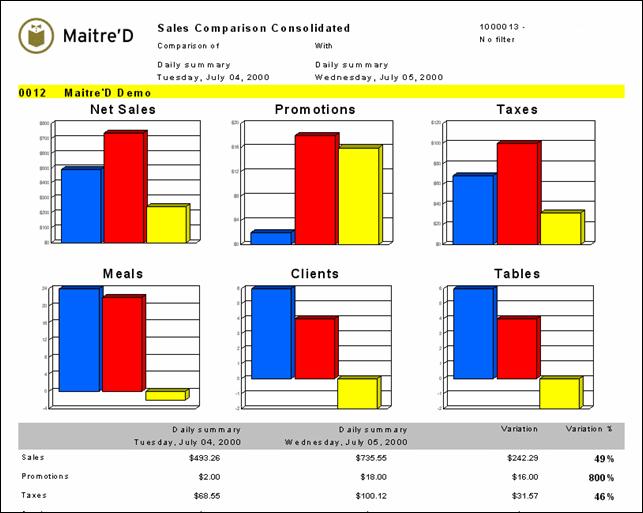
Maitre'D Sales Comparison consolidated report compares net sales, promotions (discounts), taxes, service, the quantity of meals sold, the amount of clients served and the quantity of tables served between 2 specific dates or 2 specific period of time. From a report filter window, you select the appropriate dates or date range, Revenue Center and mode for which you need information. The following is a sample of the Sales comparison consolidated report:
You have a graphic with columns to help you visualize the information between the 2 dates or the 2 period of time. Also, you get a detailed list of all the information shown on the graphic for the 2 dates or the 2 period of time. The first column shows the fiscal date and the second column shows the comparison date.
Sales:
Net sales
Promotions:
Totals discounted $ amount
Taxes:
Total taxes
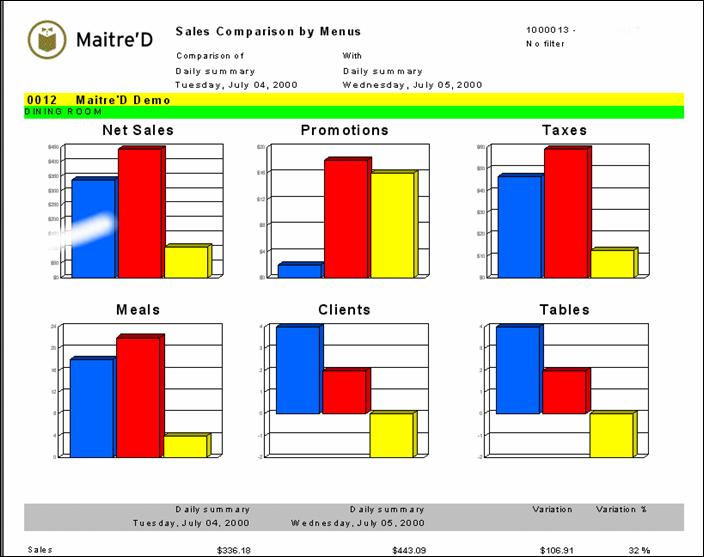
Maitre'D Sales comparison by Revenue Centers report compares net sales, promotions (discounts), taxes, service, the quantity of meals sold, the amount of clients served and the quantity of tables served between 2 specific dates or 2 specific period of time for each Revenue Center. From a report filter window, you select the appropriate dates or date range, Revenue Center and mode you need information on. The following is a sample of the Sales comparison by Revenue Centers report:
For each Revenue Center you have a graphic with columns to help you visualize the information between the 2 dates or the 2 period of time. Also, for each Revenue Center you get a detailed list of all the information shown on the graphic for the 2 dates or the 2 period of time. The first column shows the fiscal date and the second column shows the comparison date.
Sales:
Net sales
Promotions:
Totals discounted $ amount
Taxes:
Total taxes
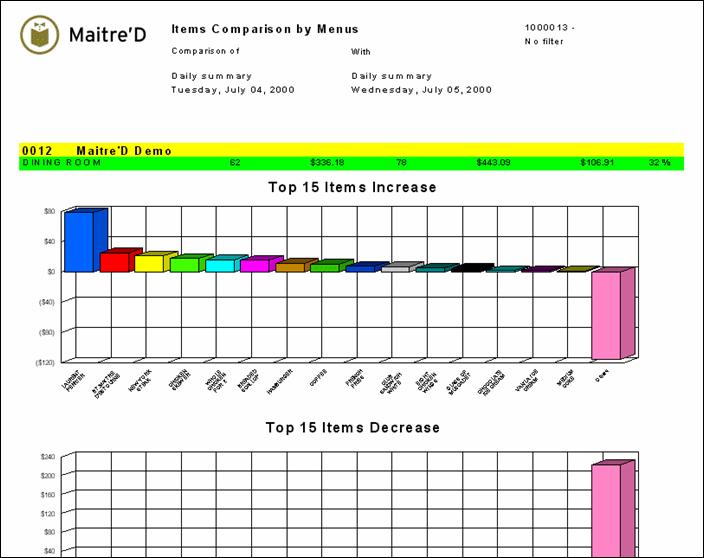
Maitre'D Items comparison by Revenue Center report compares item gross sales by category for each Revenue Center. The graphic shows you the gross sales variation for the 2 dates or the 2 dates range period selected. The graphic is divided in 2 sections: top 15 items increase and top 15 items decrease. One section provides you with 15 items that had the highest increase in variation and the second one provides you with 15 items that had the most decrease in variation. From a report filter window, you select the appropriate dates or date range, the appropriate comparison date or date range, category, division, Revenue Center and mode for which you need information. The following is a sample of the Items comparison by Revenue Center report:
You get a detailed list of all the information shown on the graphic for the 2 dates or the 2 period of time selected. The items are sorted in numerical and alphabetical order. The item # precedes each item. The first set of columns shows information on the fiscal date and the second set of columns shows information on the comparison date.
For each item find:
Quantity:
Quantity of item sold (applies to the fiscal and comparison date)
Amount:
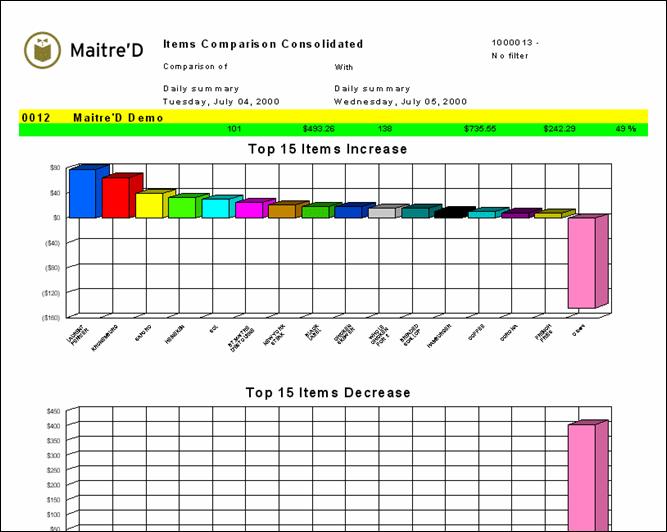
Maitre'D item comparison consolidated report compares the items gross sales. The graphic shows you the gross sales variation for the 2 dates or the 2 dates range period selected. The graphic is divided in 2 sections: top 15 items increase and top 15 items decrease. One section provides you with 15 items that had the highest increase in variation and the second one provides you with 15 items that had the most decrease in variation. From a report filter window, you select the appropriate dates or date range, the appropriate comparison date or date range, categories, divisions, Revenue Centers and modes for which you need information. The following is a sample of the items comparison consolidated report:
You get a detailed list of all the information shown on the graphic for the 2 dates or the 2 period of time selected. The items are sorted by item#. The first set of columns shows information on the fiscal date and the second set of columns shows information on the comparison date.
For each item find:
Quantity:
Quantity of item sold (applies to the fiscal and comparison date)
Amount:
Item gross sales (applies to the fiscal and comparison date)
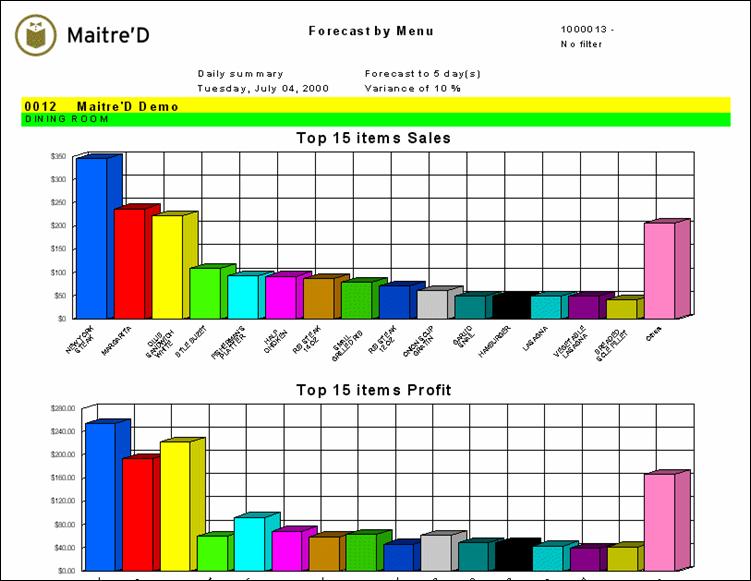
Maitre'D's items Forecast by Revenue Center report shows you your forecast sales and profit per Revenue Center for the specific amount of days and variance needed. From the report filter window, you select the appropriate date selection, category, division, Revenue Center, mode and amount of days to include and variance needed. The graphic is divided in 2 sections: top 15 items sales and top 15 items profit. The first section provides you with the items with highest sales and the second one provides you with the items with the highest profit. Take note we only show the top 15 items. The following is a sample of the items forecast by Revenue Center report:
Under each graphic, you get a detailed list of all the information shown on the graphic. The items are sorted by $ sales. The highest sales will be at the top of the list.
Quantity:
Quantity of the item expected to sale
Description
Revenue Center item description
Id:
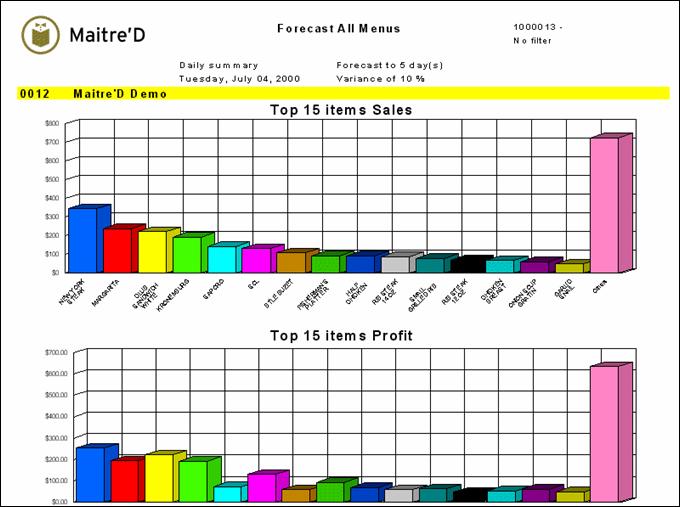
Maitre'D's item forecast consolidated report shows you your forecast sales and profit for the specific amount of days and variance needed. From the report filter window, you select the appropriate date selection, category, division, Revenue Center, mode and amount of days to include and variance needed. The graphic is divided in 2 sections: top 15 items sales and top 15 items profit. The first section provides you with the items with highest sales and the second one provides you with the items with the highest profit. Take note we only show the top 15 items. The following is a sample of the items forecast consolidated report:
Under each graphic, you get a detailed list of all the information shown on the graphic. The items are sorted by $ sales. The highest sales will be at the top of the list.
Quantity:
Quantity of the item expected to sale
Description:
Revenue Center item description
Id:
Revenue Center item number
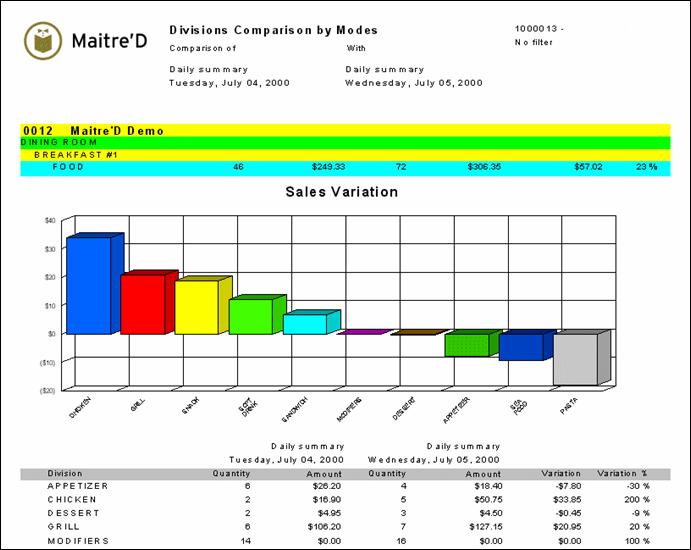
Maitre'D Divisions comparison by modes report compares division gross sales by category and mode for each Revenue Center. The graphic shows you the gross sales variation for the 2 selected date or the 2 dates range period. From a report filter window, you select the appropriate dates or date range, the appropriate comparison date or date range, category, division, Revenue Center and mode for which you need information. The following is a sample of the Division comparison by mode report:
You get a detailed list of all the information shown on the graphic for the 2 dates or the 2 period of time selected. The divisions are sorted in the order you programmed them in the Maitre'D Back-Office. The first set of columns shows information on the fiscal date and the second set of columns shows information on the comparison date.
For each division you get:
Quantity:
Quantity of item sold, belonging to the division (applies to the fiscal and comparison date)
Amount:
Division gross sales (applies to the fiscal and comparison date)
Variation:
Comparison date $ amount LESS fiscal date $ amount
Variation%:
Variation divided by the $ amount (from the fiscal date) multiply by 100
Take note: a total quantity, $ amount, variation and variation % shows up at the top of the graphic. This total includes all items belonging to the category.
Total service
Meals:
The amount of meal served
Clients:
Total amount of clients served
Tables:
Total amount of tables served
Variation:
Comparison date $ amount LESS the fiscal date $ amount
Variation %:
Variation divided by the $ amount (from the fiscal date) multiply by 100
Total service
Meals:
The amount of meal served
Clients:
Total amount of clients served
Tables:
Total amount of tables served
Variation:
Comparison date $ amount LESS the fiscal date $ amount
Variation %:
Variation divided by the $ amount (from the fiscal date) multiply by 100
Variation:
Comparison date $ amount LESS fiscal date $ amount
Variation%:
Variation divided by the $ amount (from the fiscal date) multiply by 100
Take note: a total quantity, $ amount, variation and variation % shows up at the top of the graphic. This total includes all items belonging to the category.
Comparison date $ amount LESS fiscal date $ amount
Variation%:
Variation divided by the $ amount (from the fiscal date) multiply by 100
Take note: a total quantity, $ amount, variation and variation % shows up at the top of the graphic. This total includes all items shown on the report.
Sales:
Projected sales for the item: Revenue Center item selling price multiply by the projected quantity
Percent:
Projected sales percentage: $ sales divided by the total $ sales for all 15 items multiply by 100
Cost:
Revenue Center item cost from the POS Control module multiply by the projected quantity
Profit:
Projected $ profit: sales less cost
Percent:
Projected profit percentage: $ profit divided by the $ sales multiply by 100
Take note: a total quantity, projected $ sales, cost and projected $ profit shows up at the bottom. This total includes the top 15 items.
Projected sales for the item: Revenue Center item selling price multiply by the projected quantity
Percent:
Projected sales percentage: $ sales divided by the total $ sales for all 15 items multiply by 100
Cost:
Revenue Center item cost from the POS Control module multiply by the projected quantity
Profit:
projected $ profit: sales less cost
Percent:
Projected profit percentage: $ profit divided by the $ sales multiply by 100
Take note: a total quantity, projected $ sales, cost and projected $ profit shows up at the bottom. This total includes the top 15 items.
Comparison date $ amount LESS fiscal date $ amount
Variation%:
Variation divided by the $ amount (from the fiscal date) multiply by 100
Take note: a total quantity, $ amount, variation and variation % shows up at the top of the graphic. This total includes all divisions belonging to the category.
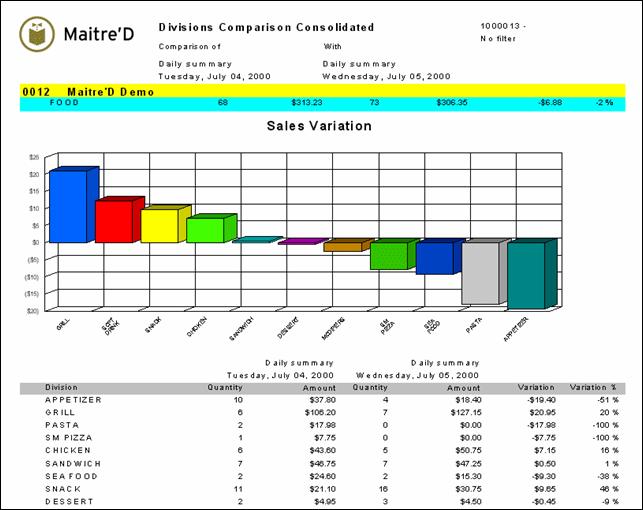
Maitre'D Divisions comparison consolidated report compares division gross sales by category. The graphic shows you the gross sales variation for the 2 dates or the 2 date range period selected. From a report filter window, you select the appropriate dates or date range, the appropriate comparison date or date range, category, division, Revenue Center and mode for the information needed. The following is a sample of the Division comparison consolidated report:
You get a detailed list of all the information shown on the graphic for the 2 dates or the 2 period of time selected. The divisions are sorted in the order you programmed them in the Maitre'D Back-Office. The first set of columns shows information on the fiscal date and the second set of columns shows information on the comparison date.
For each division find:
Quantity:
Quantity of item sold belonging to the division (applies to the fiscal and comparison date)
Amount:
Division gross sales (applies to the fiscal and comparison date)
Variation:
Comparison date $ amount LESS fiscal date $ amount
Variation%:
Variation divided by the $ amount (from the fiscal date) multiply by 100
Take note: a total quantity, $ amount, variation and variation % shows up at the top of the graphic. This total includes all divisions belonging to the category.
Items Forcoast By Consolidated
Items Forcoast By Revenue Centers
items Forcoast By Modes
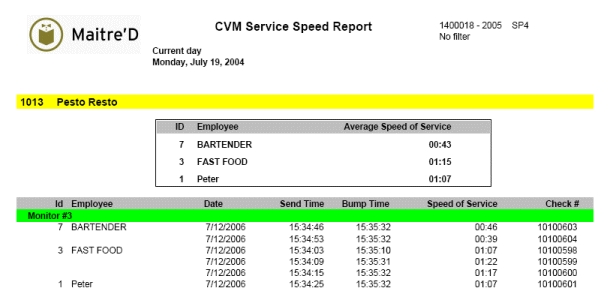
Maitre'D's CVM Service Speed report prints delays (in seconds) for each check between the order on the workstation and the completion in the kitchen. From the report filter window, select the date range and employees to be included in the report.
The following is a sample of the CVM Service Speed report
Maitre'D Sales Comparison consolidated report compares net sales, promotions (discounts), taxes, service, the quantity of meals sold, the amount of clients served and the quantity of tables served between 2 specific dates or 2 specific period of time. From a report filter window, you select the appropriate dates or date range, Revenue Center and mode for which you need information. The following is a sample of the Sales comparison consolidated report:
You have a graphic with columns to help you visualize the information between the 2 dates or the 2 period of time. Also, you get a detailed list of all the information shown on the graphic for the 2 dates or the 2 period of time. The first column shows the fiscal date and the second column shows the comparison date.
Sales:
Net sales
Promotions:
Totals discounted $ amount
Taxes:
Total taxes
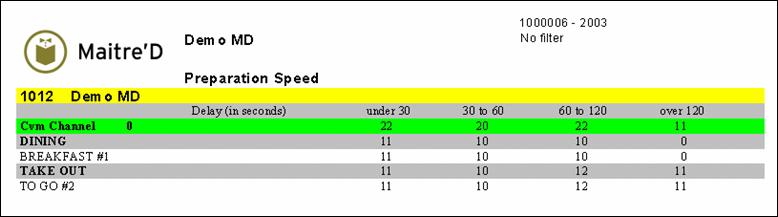
Maitre'D's preparation speed report shows you a summary of the order preparation speed of your employees according to your specifications. From the report filter window, select the dates, Revenue Centers and modes to be included in the report.
The following is a sample of the preparation speed report:
For each CVM in each Revenue Center and each mode, this report provides you with:
under 30:
Number of orders when the delay between when the orders were entered and the items were prepared was less then 30 seconds.
30 to 60:
Number of orders when the delay between when the orders were entered and the items were prepared was between 30 seconds and 1 minute.
60 to 120:
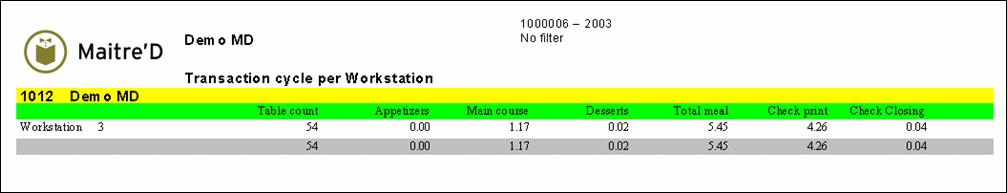
Maitre'D's transaction cycle per workstation report shows you delay average in minutes for each stage of the meal by workstations according to your specifications. From the report filter window, select the date and time range and workstations to be included in the report.
The following is a sample of the transaction cycle per workstation report:
Table count:
Number of tables accessed at this workstation.
Appetizers:
Average delay between when the clients were seated and the appetizers were ordered.
Main courses
Average delay between when the appetizers and the main courses were ordered.
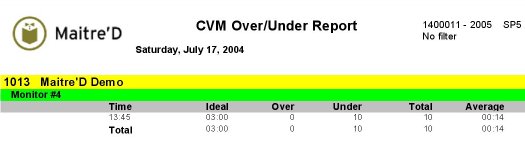
Maitre'D's CVM Over/Under report prints the number of checks for which the delays (in seconds) between the order on the workstation and the completion in the kitchen were over or under the ideal delay.
From the report filter window, select the date range and employees to be included in the report.
The following is a sample of the CVM Over/Under report
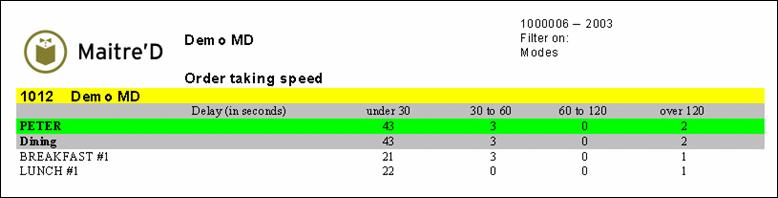
Maitre'D's order speed report shows you a summary of the order taking speed of your employees according to your specifications. From the report filter window, select the dates and employees to be included in the report.
The following is a sample of the order speed report:
For each employee in each Revenue Center and each mode, this report provides you with:
under 30:
Number of orders when the delay between when the clients were seated and the orders were entered was less then 30 seconds.
30 to 60:
Number of orders when the delay between when the clients were seated and the orders were entered was between 30 seconds and 1 minute.
60 to 120:
Total service
Meals:
The amount of meal served
Clients:
Total amount of clients served
Tables:
Total amount of tables served
Variation:
Comparison date $ amount LESS the fiscal date $ amount
Variation %:
Variation divided by the $ amount (from the fiscal date) multiply by 100
over 120:
Number of orders when the delay between when the orders were entered and the items were prepared was more then 2 minutes.
Average delay between when the main courses and the desserts were ordered.
Total meal:
Average delay between when the clients were seated and the desserts were ordered.
Check print:
Average delay between when the desserts were ordered and the checks were printed.
Check Closing:
Average delay between when the checks were printed and the checks were settled.
over 120:
Number of orders when the delay between when the clients were seated and the orders were entered was more then 2 minutes.
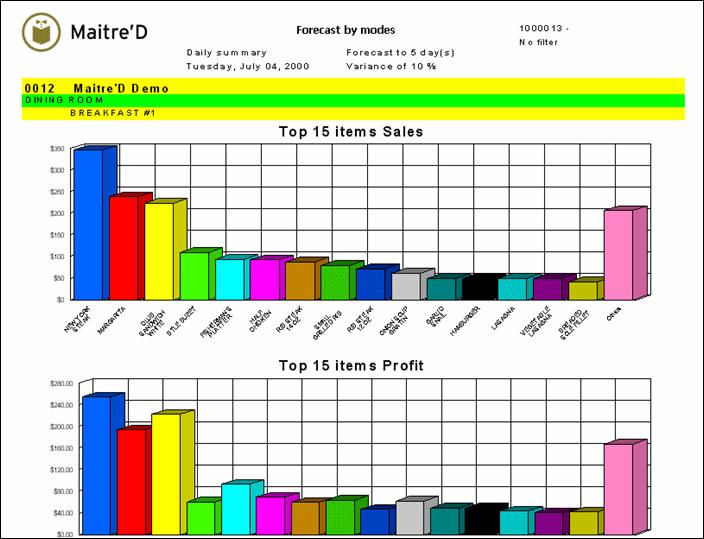
Maitre'D's items Forecast by mode report shows you your forecast sales and profit for each mode per Revenue Center for the specific amount of days and variance needed. From the report filter window, you select the appropriate date selection, category, division, Revenue Center, mode and amount of days to include and variance needed. The graphic is divided in 2 sections: top 15 items sales and top 15 items profit. The first section provides you with the items with highest sales and the second provides you with the items with the highest profit. Take note we only show the top 15 items. The following is a sample of the items forecast by mode report:
Under each graphic, you get a detailed list of all the information shown on the graphic. The items are sorted by $ sales. The highest sales will be at the top of the list.
Quantity:
Quantity of the item expected to sale
Description:
Revenue Center item description
Id:
Revenue Center item number
Sales:
Projected sales for the item: Revenue Center item selling price multiply by the projected quantity
Percent:
Projected sales percentage: $ sales divided by the total $ sales for all 15 items multiply by 100
Cost:
Revenue Center item cost from the POS Control module multiply by the projected quantity
Profit:
Projected $ profit: sales less cost
Percent:
Projected profit percentage: $ profit divided by the $ sales multiply by 100
Take note: a total quantity, projected $ sales, cost and projected $ profit shows up at the bottom. This total includes the top 15 items.
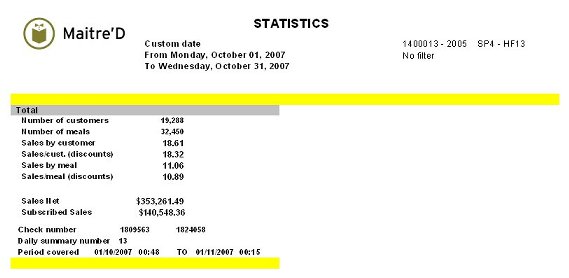
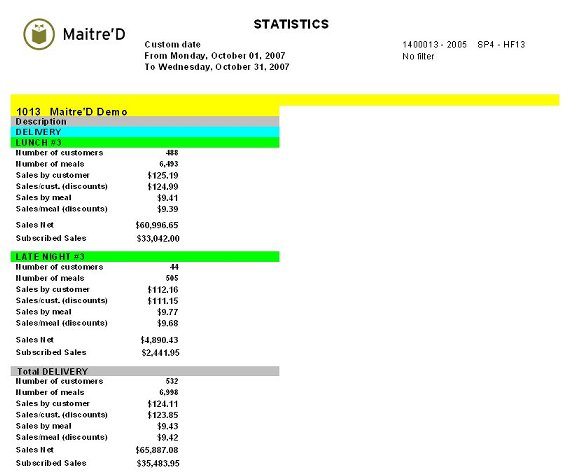
Maitre'D's Statistics report shows you sales details, by Modes and by Revenue Centers, as well as for the whole restaurant's totals with statistics, on a last page. From the report filter window, select the appropriate date frame to be included in the report. The following is a sample of the Statistics report:
The report is divided in two parts. The first part, on a separate page for each Revenue Center, prints for all Modes and Revenue Centers:
Number of Customers:
Total customer served.
Number of Meals:
Total meals served.
Sales by Customer:
Average sales per customer before discounts.
Sales/Cust. (discounts):
Average sales per customer after discounts.
Sales by Meal:
Average sales per meal before discounts.
Sales/Meal (discounts):
Average sales per meal after discounts.
Sales Net:
Total sales after discounts.
Subscribed Sales:
Total sales of all divisions the restaurant has to pay royalties on.
The second part, on a last page, prints the total for the whole restaurant, and adds the following information:
Check Number:
Beginning and ending bill numbers for that date frame.
Daily Summary Number:
Number of fiscal days from the opening of the restaurant to the last day covered by these statistics.
Period Covered:
Beginning and ending date and time included.
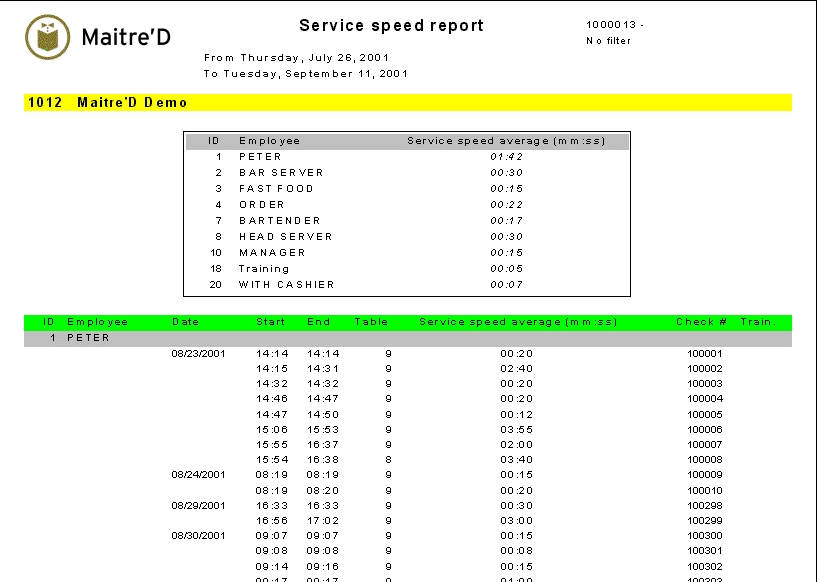
Maitre'D's Service Speed report shows you delay average in time (in seconds) for each item ordered on each check by employee. From the report filter window, select the date range, employees, to be included in the report.
The following is a sample of the service speed report
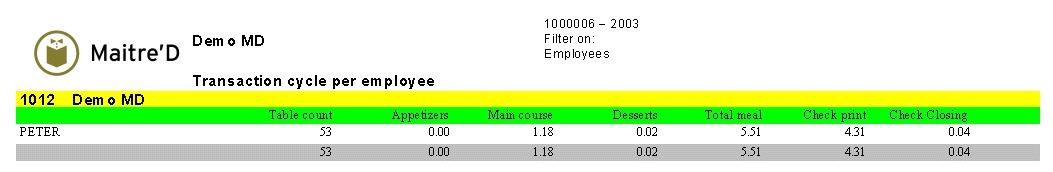
Maitre'D's transaction cycle per employee report shows you delay average in minutes for each stage of the meal by employees according to your specifications. From the report filter window, select the date and time range and employees to be included in the report.
The following is a sample of the transaction cycle per employee report:
Table count:
Number of tables served by this employee.
Appetizers:
Average delay between when the clients were seated and the appetizers were ordered.
Main courses
Average delay between when the appetizers and the main courses were ordered.
Desserts:
Average delay between when the main courses and the desserts were ordered.
Total meal:
Average delay between when the clients were seated and the desserts were ordered.
Check print:
Average delay between when the desserts were ordered and the checks were printed.
Check Closing:
Average delay between when the checks were printed and the checks were settled.