Loading...
Loading...
Loading...
Loading...
Loading...
Loading...
Loading...
Loading...
Loading...
Loading...
Loading...
Loading...
Loading...
Loading...
Loading...
Loading...
Loading...
Loading...
Loading...
Loading...
Loading...
Loading...
Loading...
Loading...
Loading...
Loading...
Loading...
Loading...
Loading...
Loading...
Loading...
Loading...
Loading...
Loading...
Loading...
Loading...
Loading...
Loading...
Loading...
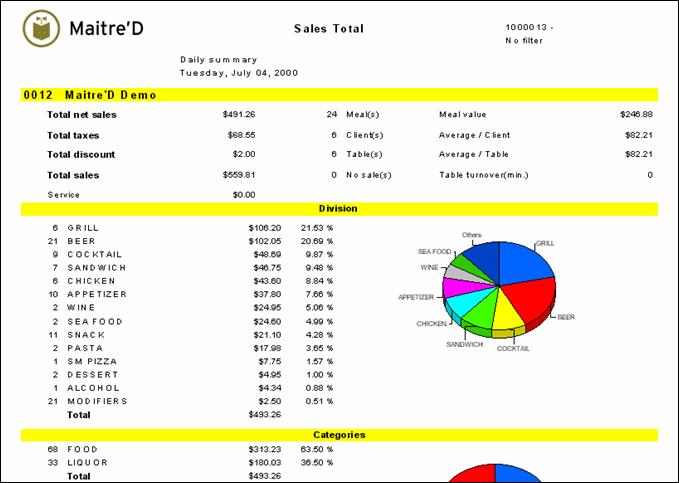
Maitre'D Sales Consolidated Report shows the restaurant's sales information for the date or the period of time requested. The following is a sample of the Sales consolidated report:
The report is divided in different sections. The first section provides you with:
Total net sales
Sales after all discounted $ amounts, and before taxes.
Total taxes
Total of all taxes charged to the customers.
Total discounts
Total of all discounts applied during the day.
Total Sales
Total gross sales = total net sales + total taxes.
Service
Total service charge.
# Meal(s)
Total number of meal served.
# Client(s)
Total client served.
# Table(s
Total number of tables served.
No sale(s)
The number of times the cash drawer was opened without any sales being done.
Meal value
Total $ value for all meals served.
Average / Client
An average $ amount by clients.
Average / table
An average $ amount by tables.
Table turnover (min.)
An average of the amount of time before a table turnover occurs.
Frequent Diner(s)
Total Number of Frequent Diner served.
Reward Coupon(s)
Total Number of Reward Coupon Diner emitted
Division
For each workstation this section provides you with the gross sales by division and the % of sales each division represents. Beside each division you get the quantity of items sold to that division. Gross sales = sales before any discount and before any tax. % = Division sales / total sales for the restaurant x 100 Total = total gross sales for the restaurant
Categories
This section provides you with the gross sales by category and the % of sales each category represents. Besides each category you get the quantity of item sold belonging to that category. Gross sales = sales before any discount and before any tax. % = Division sales / total sales for the restaurant x 100 Total = total gross sales for the restaurant
Media
This section provides you with the total of each media type and the % this media represents over all medias.
Taxes
This section provides you with the total of each tax. The total of all taxes shows up at the bottom.
Discount
This section provides you with the total for each discount. A total including all discounts shown at the bottom.
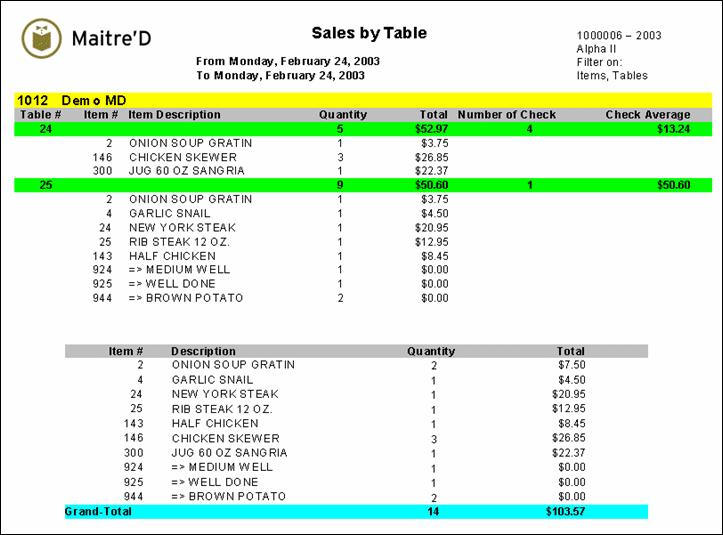
Maitre'D sales by table report shows sales items information by table for the date or the period of time requested. From the report filter window, select the appropriate dates, amounts, invoice numbers, tables, employees, items, Revenu Centers and modes to be included in the report.
The following is a sample of the sales by table report:
The report is divided in two sections. For each table, the first section provides you with:
Table #
Table number.
Item #
Individual item numbers.
Item Description
Individual item descriptions.
Quantity
Total and individual item quantities.
Total
Total and individual item values.
Number of Check
Total number of checks.
Check Average
Total item value divided by total number of checks.
For all tables, the second section provides you with:
Item #
Individual item numbers.
Description
Individual item descriptions.
Quantity
Individual and total item quantities.
Total
Individual and total item values.
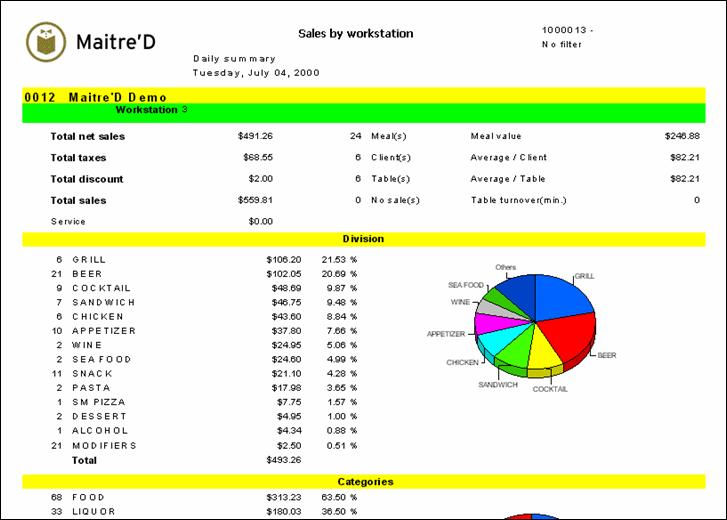
Maitre'D Sales by Workstation report shows sales information by workstation for the date or the period of time requested. From a report filter window, select the appropriate date or date range, workstation for the information needed.
The following is a sample of the Sales by Workstation report:
The report is divided by workstation, which is subdivided in different sections. For each workstation the first section provides you with:
Total net sales
Sales after all discounted $ amounts, and before taxes.
Total taxes
Total of all taxes charged to the customers.
Total discounts
Total of all discounts applied during the day.
Total Sales
Total gross sales = total net sales + total taxes.
Service
Total service charge.
# Meal(s)
Total number of meal served.
# Client(s)
Total number of client served.
# Table(s
Total number of tables served.
No sale(s)
The number of times the cash drawer was opened without any sales being done.
Meal value
Total $ value for all meals served.
Average / Client
An average $ amount by clients.
Average / table
An average $ amount by tables.
Table turnover (min.)
An average of the amount of time before a table turnover occurs.
Frequent Diner(s)
Total Number of Frequent Diner served.
Reward Coupon(s)
Total Number of Reward Coupon Diner emitted
Division
For each workstation this section provides the gross sales by division and the % of sales each division represents. Besides each division, you get the quantity of items sold to that division. Gross sales = sales before any discounts and taxes. % = Division sales / total sales for the workstation shift and drawer x 100
Total = total gross sales for the workstation shift and drawer.
Categories
For each workstation, this section provides you with the gross sales by category and the % of sales each category represents. Beside each category you get the quantity of item sold belonging to that category. Gross sales = sales before any discounts and taxes. % = Division sales / total sales for the workstation shift and drawer x 100 Total = total gross sales for the workstation shift and drawer.
Media
For each workstation this section provides you with the total of each media type, and the % this media represents over all medias.
Taxes
For each workstation this section provides you with the total for each tax. The total of all taxes show at the bottom.
Discount
For each workstation this section provides you with the total of each discounts. The total including all discounts, show at the bottom.
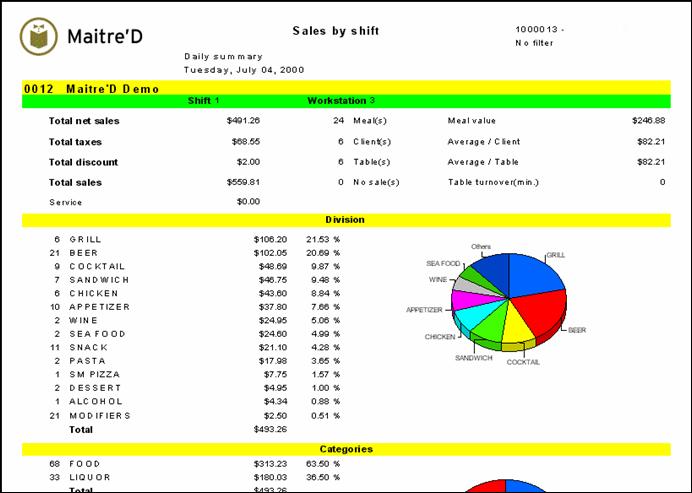
Maitre'D Sales by Shift Report shows sales information by workstation shift for the date or the period of time requested. From a report filter window, you select the appropriate date or date range, workstation, shift for which you need information. The following is a sample of the Sales by Shift report:
The report is divided by workstation and shift, which is subdivided in different sections. For each workstation and shift, the first section provides you with:
Total net sales
Sales after all discounted $ amounts, and before taxes.
Total taxes
Total of all taxes charged to the customers.
Total discounts
Total of all discounts applied during the day.
Total Sales
Total gross sales = total net sales + total taxes.
Service
Total service charge.
# Meal(s)
Total number of meal served.
# Client(s)
Total number of client served.
# Table(s
Total number of tables served.
No sale(s)
The number of times the cash drawer was opened without any sales being done.
Meal value
Total $ value for all meals served.
Average / Client
An average $ amount by client.
Average / table
An average $ amount by table.
Table turnover (min.)
The average amount of time occurs a table turnover.
Frequent Diner(s)
Total Number of Frequent Diner served.
Reward Coupon(s)
Total Number of Reward Coupon Diner emitted
Division
For each workstation and shift, this section provides the gross sales by division and the % of sales each division represents. Besides each division, you get the quantity of items sold to that division. Gross sales = sales before any discounts and taxes. % = Division sales / total sales for the workstation shift and drawer x 100 Total = total gross sales for the workstation shift and drawer.
Categories
For each workstation shift, this section provides you with the gross sales by category and the % of sales each category represents. Beside each category you get the quantity of item sold belonging to that category. Gross sales = sales before any discounts and taxes. % = Division sales / total sales for the workstation shift and drawer x 100 Total = total gross sales for the workstation shift and drawer. Media
For each workstation shift this section provides you the total of each media type, and the % this media represents over all medias.
Taxes
For each workstation shift, this section provides you with the total for each tax. The total of all taxes show at the bottom.
Discount
For each workstation shift this section provides you with the total of each discounts. The total including all discounts, show at the bottom.
Maitre'D Sales by Drawer Report shows sales information by workstation shift and drawer for the date or the period of time requested. From a report filter window, you select the appropriate date or date range, workstation, shift and drawer for which you need information.
The report is divided by: workstation, shift and drawer, which are subdivided into different sections. For each workstation shift and drawer, the first section provides you with:
Total net sales
Total sales after all discounted $ amounts and before taxes.
Total taxes
Total of all taxes charged to the customers.
Total discounts
Total of all discounts applied during the day.
Total Sales
Total gross sales = total net sales + total taxes
Service
Total service charge
# Meal(s)
Total number of meal served.
# Client(s)
Total client served
# Table(s
Total number of tables served.
No sale(s)
The number of times the cash drawer was opened without any sales being done.
Meal value
Total $ value for all meal served
Average / Client
An average $ amount by client.
Average / table
An average $ amount by table.
Table turnover (min.)
The average number of time occurs a table turnover.
Frequent Diner(s)
Total Number of Frequent Diner served.
Reward Coupon(s)
Total Number of Reward Coupon Diner emitted
For each workstation shift and drawer, this section provides the gross sales by division and the % of sales each division represents. Besides each division, you get the quantity of items sold to that division. Gross sales = sales before any discounts and taxes. % = Division sales / total sales for the workstation shift and drawer x 100 Total = total gross sales for the workstation shift and drawer.
For each workstation shift and drawer, this section provides you with the gross sales by category and the % of sales each category represents. Beside each category you get the quantity of item sold belonging to that category. Gross sales = sales before any discounts and taxes. % = Category sales / total sales for the workstation shift and drawer x 100 Total = total gross sales for the workstation shift and drawer.
For each workstation shift and drawer this section provides you with the total for each media type and the % this media represents over all media.
For each workstation shift and drawer this section provides you with the total for each tax. The total of all taxes shows up at the bottom.
For each workstation shift and drawer this section provides you with the total for each discount. A total including all discounts shows up at the bottom.
Maitre'D Top 15 items by modes Report shows the top 15 items sold by Revenu Center and mode for the date or the period of time requested. From a report filter window, you select the appropriate date or date range, categories, divisions, Revenu Centers and modes for which you need information. The following is a sample of the Top 15 items by modes report:
For each Revenu Center and for each mode you get a graphic of the top 15 items sold. You can visualize and compare the $ sales and the $ profit between the top items. Under net you can find a list of the top 15 items with the following information:
Quantity:
Total quantity sold
Description:
Revenu Center item description from the POS Control module, it corresponds to the regular description
Id:
Corresponds to the Revenu Center item # from the POS Control module combined with restaurant number (that start with 100,000).
Sales:
Total gross sales (before any discount is applied) for the Revenu Center item
Percent:
Percentage the Revenu Center item sales towards the top 15 items total sales
Cost:
Revenu Center item cost from the POS Control module
Profit:
Is the Revenu Center item Sales less the Revenu Center item Cost
Percent:
Is the Revenu Center item Profit divided by the Revenu Center item Sales multiply by 100 Then you find a total quantity, total sales, total cost and total profit for the top 15 items.
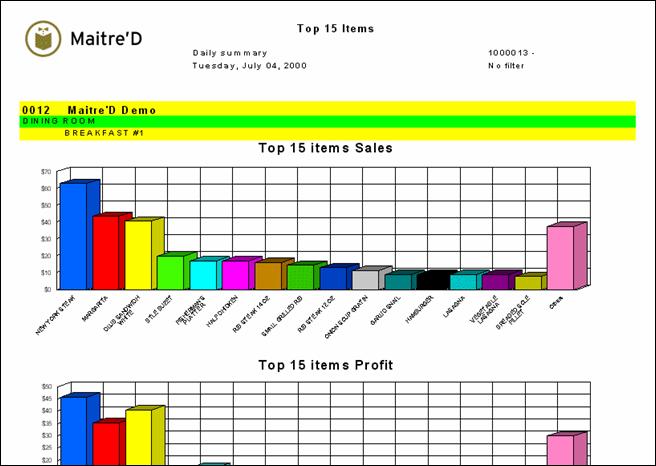
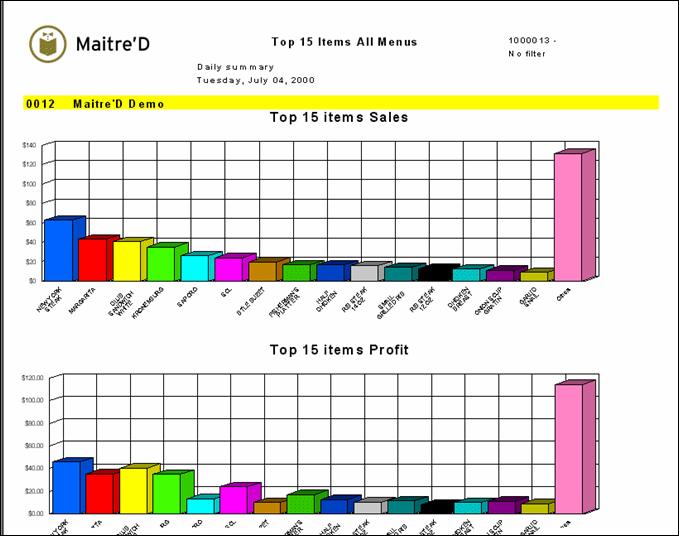
Maitre'D Top 15 items consolidated Report shows information of top 15 items of all Revenue Centers condensed together, for the date or the period of time requested. From a report filter window, you select the appropriate date or date range, categories, divisions, Revenue Centers and modes for which you need information. The following is a sample of the Top 15 items consolidated report:
You get a graphic of the top 15 items sold for all Revenue Centers condensed. You can visualize and compare the $ sales and the $ profit between those top items. Under net you can find a list of the top 15 items with the following information: For each Revenue Center and mode you get a graphic of the top 15 items sold. You can visualize and compare the $ sales and the $ profit between the top items. Under net you can find a list of the top 15 items with the following information:
Quantity:
Total quantity sold
Description:
Revenue Center item description from the POS Control module, it corresponds to the regular description
Id:
Corresponds to the Revenue Center item # from the POS Control module.
Sales:
Total gross sales (before any discount is applied) for the Revenue Center item
Percent:
Percentage the Revenue Center item sales towards the top 15 items total sales
Cost:
Revenue Center item cost from the POS Control module
Profit:
Is the Revenue Center item Sales less the Revenue Center item Cost
Percent:
Is the Revenue Center item Profit divided by the Revenue Center item Sales multiply by 100 Then you find a total quantity, total sales, total cost and total profit for the top 15 items
Maitre'D Top 15 items by Revenue Center Report shows the top 15 items sold by Revenue Center for the date or the period of time requested. From a report filter window, you select the appropriate date or date range, categories, divisions, Revenue Centers and modes for information needed. The following is a sample of the Top 15 items by Revenue Center report:
For each Revenue Center and mode you get a graphic of the top 15 items sold. You can visualize and compare the $ sales and the $ profit between the top items. Under net you can find a list of the top 15 items with the following information:
Quantity:
Total quantity sold
Description:
Revenue Center item description from the POS Control module, it corresponds to the regular description
Id:
Corresponds to the Revenue Center item # from the POS Control module (combined with the restaurant index number).
Sales:
Total gross sales (before any discount is applied) for the Revenue Center item
Percent:
Percentage the Revenue Center item sales towards the top 15 items total sales
Cost:
Revenue Center item cost from the POS Control module
Profit:
Is the Revenue Center item Sales less the Revenue Center item Cost
Percent:
Is the Revenue Center item Profit divided by the Revenue Center item Sales multiply by 100
Then you find a total quantity, total sales, total cost and total profit for the top 15 items.
Maitre'D's Daily Permanent Sales Report shows you the same non-resettable totals as the Permanent Report, but on a daily basis. It acts like a journal printer and keeps running sales since the beginning of the restaurant's operation. The following is a sample of the Daily Permanent Sales report:
Date:
Accounting day.
Sales Total:
Total sales since the beginning of the restaurant's operation.
Sales Daily:
Difference between total sales after that day and total sales before that day.
Discounts Total:
Total of all discounts since the beginning of the restaurant's operation.
Discounts Daily:
Difference between total discounts after that day and total discounts before that day.
Taxes Total:
Total of all taxes since the beginning of the restaurant's operation.
Taxes Daily:
Difference between total taxes after that day and total taxes before that day.
Voids Total:
Total of all voids since the beginning of the restaurant's operation.
Voids Daily:
Difference between total voids after that day and total voids before that day.
Training Total:
All training sales since the beginning of the restaurant's operation.
Training Daily:
Difference between total training sales after that day and total training sales before that day.
Maitre'D's Permanent Report shows you the Maitre'D key information, the non-resettable totals. It acts like a journal printer and keeps running sales since the beginning of the restaurant's operation. The following is a sample of the Permanent report:
Last closing day:
Last close accounting day
Reset Date:
The last date and time the sales deletion occurred to start the restaurant "LIVE"
Access Date:
The last date and time the key was access, updated.
Sales total:
Total sales since the beginning of the restaurant's operation
Discounts total:
Total of all discounts since the beginning of the restaurant's operation
Taxes total:
Total of all taxes since the beginning of the restaurant's operation
Voids total:
Total of all voids since the beginning of the restaurant's operation
Training total:
All training sales since the beginning of the restaurant's operation
Maitre'D DSR Report (Daily Summary Report) compares sales (gross sales), taxes, media types, discounts and daily deposit for the selected week or date range. This report shows you a cash deposit only if you have the field "daily deposit" selected under the P.O.S. Control / view / option.
Sales:
Represents the gross sales before any discount and before any taxes. For each day you get the $ sales per category and the percentage (category sales divided by total sales x 100) it represents from the total gross sales. In this section you also have a total sales and a total %.
Taxes:
Represent each tax's total and then total taxes.
POS TOT SALES:
Total sales + Total Taxes
Payment:
The 1st part of this section shows you total for the media type, 2 to 25, the total for payment received against a receivable account or a room charge. The 2nd part of this section adds up paid in and gift certificate sold to the 1st part and then the last part adds up the paid out to the 2nd part.
TOTAL PAYMENTS:
Total of all subtotals from the payment section.
Discount:
Lists all discounts used with their total $ amount and then a total of all discounted $ amount
TOTAL NON-CASH:
TOTAL PAYMENTS + TOTAL DISCOUNTS
CASH DEPOSIT:
Shows you a cash deposit only if you have the field "daily deposit" selected under the P.O.S. Control / view / option at the restaurant site. When this option isselected at the restaurant site, the end of the day prompts the restaurant owner/manager for the cash deposit. This cash deposit will then be included in the DBF conversion and will be transferred to the head office.
SALES - PAYMENT - DISCOUNT
What your cash deposit should be
TOTAL RECEIPTS:
TOTAL NON-CASH + CASH DEPOSIT
OVER/SHORT
TOTAL NON-CASH less POS TOT SALES + CASH DEPOSIT
OR if daily deposit not activated under POS Control then TOTAL NON-CASH less POS TOT SALES
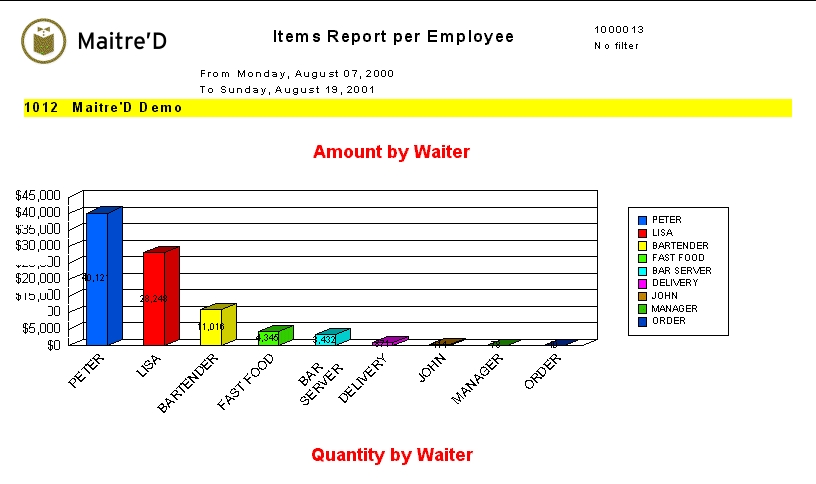
Maitre'D item report per employee shows the total $ amount sold for each employees and the number of items with the description
The following is a sample of the Items Report per Employee report:
Amount by waiter
This is the total amount of sales for each waiter for the selected period
Quantity by waiter
This is the number total of item sold by each waiter
Maitre'D's Daybook report shows you sales details, by modes and by Revenue Centers, on the first pages, as well as discount details, deposit details, and statistics, on a last page. From the report filter window, select the appropriate date to be included in the report. It is also possible to force the user to enter the deposit amount before they can run the EOD. If you wish to do so, the "Daily deposit" option under P.O.S. Control / View / Option must be enabled. The following is a sample of the daybook report:
The report is divided in two parts. The first part, for all Revenue Centers and individual Revenue Centers and modes, provides you with:
Category
Description of Division Category.
Gross sales
Total of all sales before discounts.
Total discounts
Total of all discounts applied during the day.
Cust. count
Total client served.
Taxes
Individual taxes.
Total taxes
Total of all taxes applied.
Total
Gross sales plus total taxes.
The first part provides you with totals for all Revenue Centers and modes of:
Discount details
Description of individual discounts.
Total discount
Total of all discounts applied.
Daily deposit
Description of individual media types other then cash.
Total charges
Total of all media types other then cash.
Total cash
Total cash collected.
Cash deposit
Amount deposited to the General Ledger.
Balance
Total cash minus cash deposit.
Total deposit
Total charges plus cash deposit.
Total Sales: Total sale of all revenue centers and modes.
Other information
Description of individual Revenue Centers.
Customer
Total customer served for each Revenue Center.
Average
Average sales per customer for each Revenue Center.
Meals
Total meals served for each Revenue Center.
Average
Average sales per meal for each Revenue Center.
Total
Total customers, average sales per customer, total meals and average sales per meal for all Revenue Centers.
Void summary
Number and value of all voids for all Revenue Centers.
First and last bill numbers
Beginning and ending bill numbers for that fiscal day.
Period covered
Beginning and ending date and time for that fiscal day.
Maitre'D sales per division category by mode report shows category information by mode for the date or the period of time requested. From the report filter window, select the appropriate dates, categories, divisions, Revenue Centers and modes to be included in the report.
The following is a sample of the sales per division category by mode report:
This report is divided in two sections. For each individual Revenue Center, and for each mode, the first section provides you with:
Quantity
Quantity of items sold, by division category and total.
Sales
Sales value of items sold, by division category and total.
Percentage
Percentage of sales value of each division category.
For all Revenue Centers, the Total line provides you with:
Quantity
Total quantity of items sold.
Sales
Total sales value of items sold.
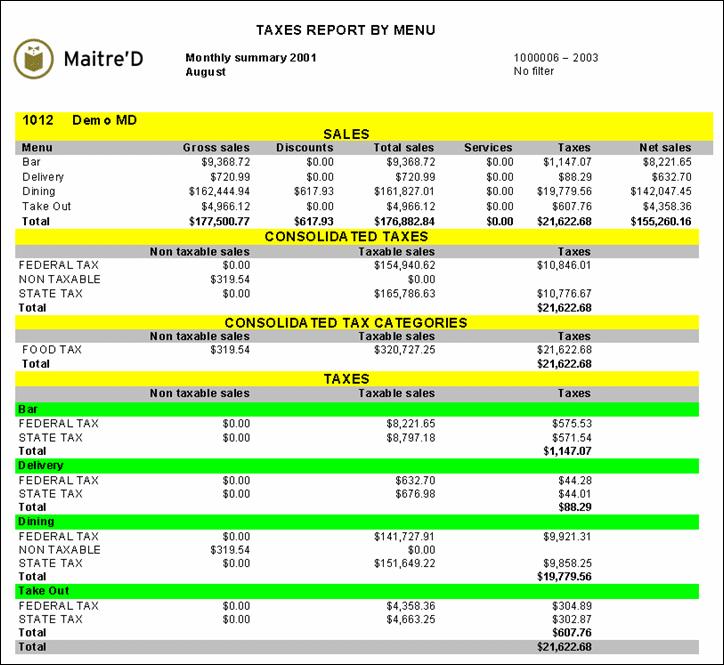
Maitre'D taxes by Revenue Center report shows taxes information by Revenue Center for the date or the period of time requested. From the report filter window, select the appropriate dates, Revenue Centers and modes to be included in the report.
The following is a sample of the taxes by Revenue Center report:
The report is divided in four sections. For each Revenue Center, the Sales section provides you with:
Revenue Center
Revenue Center description.
Gross sales
Sales including discounts, service charges and net sales.
Discounts
Discounts applied in this Revenue Center.
Total sales
Gross sales minus discounts.
Services
Service charges applied for this Revenue Center.
Taxes
Total of taxes applied on taxable sales for this Revenue Center.
Net sales
Total sales minus service charges and taxes.
For all taxes, the Consolidated Taxes section provides you with:
Non taxable sales
Sales on which no taxes apply.
Taxable sales
Sales on which any tax is applied.
Taxes
Taxes applied on taxable sales.
For all tax categories, the Consolidated Tax Categories section provides you with:
Non taxable sales
Sales on which no taxes apply.
Taxable sales
Sales on which any tax is applied.
Taxes
Taxes applied on taxable sales.
For all Revenue Centers, the Taxes section provides you with:
Non taxable sales
Sales on which no taxes apply for this Revenue Center.
Taxable sales
Sales on which any tax is applied for this Revenue Center.
Taxes
Total of taxes applied on taxable sales for this Revenue Center.
Maitre'D taxes by mode report shows taxes information by Revenue Center and mode for the date or the period of time requested. From the report filter window, select the appropriate dates, Revenue Centers and modes to be included in the report.
The following is a sample of the taxes by mode report:
For each Revenue Center, this report is divided in three sections.
For each mode, the Sales section provides you with:
Gross sales
Sales including discounts, service charges and net sales.
Discounts
Discounts applied in this mode.
Total sales
Gross sales minus discounts.
Services
Service charges applied for this mode.
Taxes
Total of taxes applied on taxable sales for this mode.
Net sales
Total sales minus service charges and taxes.
For each mode, the Taxes section provides you with:
Non taxable sales
Sales on which no tax apply.
Taxable sales
Sales on which any tax is applied.
Taxes
Taxes applied on taxable sales.
For each mode, the Tax Categories section provides you with:
Non taxable sales
Sales on which no tax apply.
Taxable sales
Sales on which any tax is applied.
Taxes
Taxes applied on taxable sales.
For all modes and Revenue Centers, the Total line provides you with:
Gross sales
Total sales including discounts, service charges and net sales.
Discounts
Total discounts applied in all modes and Revenue Centers.
Total sales
Total gross sales minus discounts.
Services
Total service charges applied for all modes and Revenue Centers.
Taxes
Total of taxes applied on taxable sales.
Net sales
Total sales minus service charges and taxes.
Maitre'D sales per division category by Revenue Center report shows category information by Revenue Center for the date or the period of time requested. From the report filter window, select the appropriate dates, categories, divisions, Revenue Centers and modes to be included in the report.
The following is a sample of the sales per division category by Revenue Center report:
This report is divided in two sections. For all Revenue Centers, the first section provides you with:
Quantity
Quantity of items sold, by division category and total.
Sales
Sales value of items sold, by division category and total.
Percentage
Percentage of sales value of each division category.
For each individual Revenue Center, the second section provides you with:
Quantity
Quantity of items sold, by division category and total.
Sales
Sales value of items sold, by division category and total.
Percentage
Percentage of sales value of each division category.
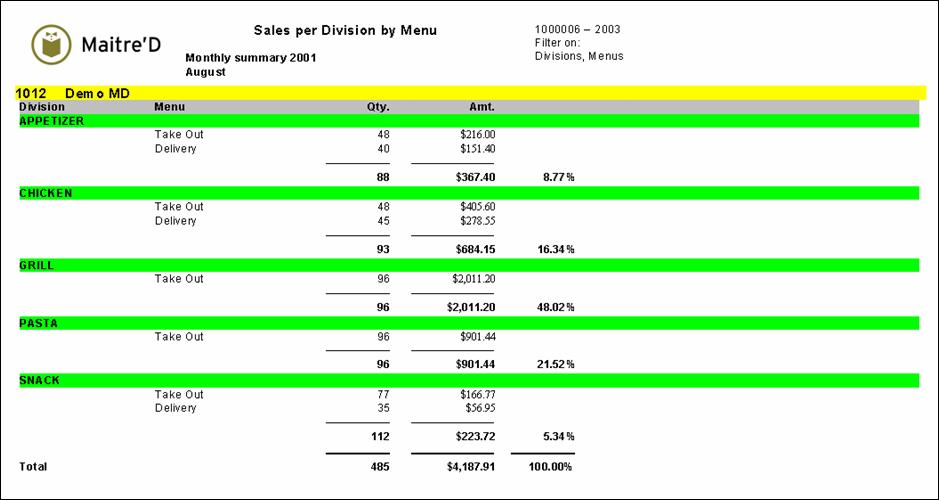
Maitre'D sales per division by Revenue Center report shows division information by Revenue Center for the date or the period of time requested. From the report filter window, select the appropriate dates, Revenue Centers and divisions to be included in the report.
The following is a sample of the sales per division by Revenue Center report:
This report is divided in two sections. For each individual Revenue Center and mode, the first eight columns of the first section provide you with:
Qty.
Quantity of items sold, by division and total in this mode.
Amt.
Sales value of items sold, by division and total in this mode.
For each individual Revenue Center, the last three columns of the first section provide you with:
Qty.
Quantity of items sold, by division and total for all modes.
Amt.
Sales value of items sold, by division and total for all modes.
Percentage
Percentage of sales value of each division.
For each division, the second section provides you with:
Division
Description of the division.
Revenue Center
Description of the Revenue Center.
Qty.
Quantity of items sold, by Revenue Center and total for this division.
Amt.
Sales value of items sold, by Revenue Center and total for this division.
Percentage
Percentage of sales value of each division.
The following is a sample of the Sales Consolidated per Item and Mode by Division report
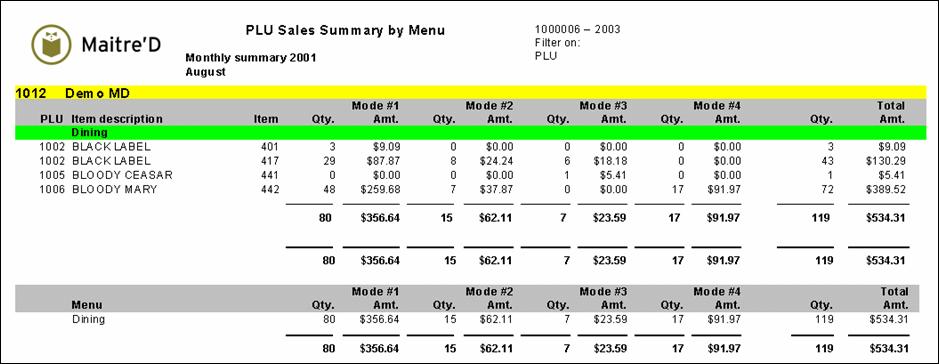
Maitre'D PLU sales summary by division report shows PLU information by division for the date or the period of time requested. From the report filter window, select the appropriate dates, PLUs, and divisions to be included in the report.
The following is a sample of the PLU sales summary by division report:
This report is divided in two sections. For each division, the first two columns of the first section provide you with:
PLU
Code of the PLU.
Description
Description of the PLU.
For each division, the next eight columns of the first section provide you with:
Qty.
Quantity of PLU sold in each mode, by PLU and total for all PLUs.
Amt.
Value of PLU sold in each mode, by PLU and total for all PLUs.
For each division, the last two columns of the first section provide you with:
Qty.
Quantity of PLU sold in all modes, by PLU and total for all PLUs.
Amt.
Value of PLU sold in all modes, by PLU and total for all PLUs.
For each division, the first column of the second section provides you with:
Division
Description of the division.
For each division, the next eight columns of the second section provide you with:
Qty.
Quantity of PLU sold in each mode, by division and total for all divisions.
Amt.
Value of PLU sold in each mode, by division and total for all divisions.
For each division, the last two columns of the second section provide you with:
Qty.
Quantity of PLU sold in all modes, by division and total for all divisions.
Amt.
Value of PLU sold in all modes, by division and total for all divisions.
Maitre'D PLU sales summary by Revenue Center report shows PLU information by Revenue Center for the date or the period of time requested. From the report filter window, select the appropriate dates, PLUs, and Revenue Centers to be included in the report.
The following is a sample of the PLU sales summary by Revenue Center report:
This report is divided in two sections. For each Revenue Center, the first three columns of the first section provide you with:
PLU
Code of the PLU.
Item description
Description of the sales item.
Item
Code of the sales item in P.O.S. Control.
For each Revenue Center, the next eight columns of the first section provide you with:
Qty.
Quantity of sales item sold in each mode, by sales item and total for all sales items.
Amt.
Value of sales item sold in each mode, by sales item and total for all sales items.
For each Revenue Center, the last two columns of the first section provide you with:
Qty.
Quantity of sales item sold in all modes, by sales item and total for all sales items.
Amt.
Value of sales item sold in all modes, by sales item and total for all sales items.
For each Revenue Center, the first column of the second section provides you with:
Division
Description of the Revenue Center.
For each Revenue Center, the next eight columns of the second section provide you with:
Qty.
Quantity of sales items sold in each mode, by Revenue Center and total for all Revenue Centers.
Amt.
Value of sales items sold in each mode, by Revenue Center and total for all Revenue Centers.
For each Revenue Center, the last two columns of the second section provide you with:
Qty.
Quantity of sales items sold in all modes, by Revenue Center and total for all Revenue Centers.
Amt.
Value of sales items sold in all modes, by Revenue Center and total for all Revenue Centers.
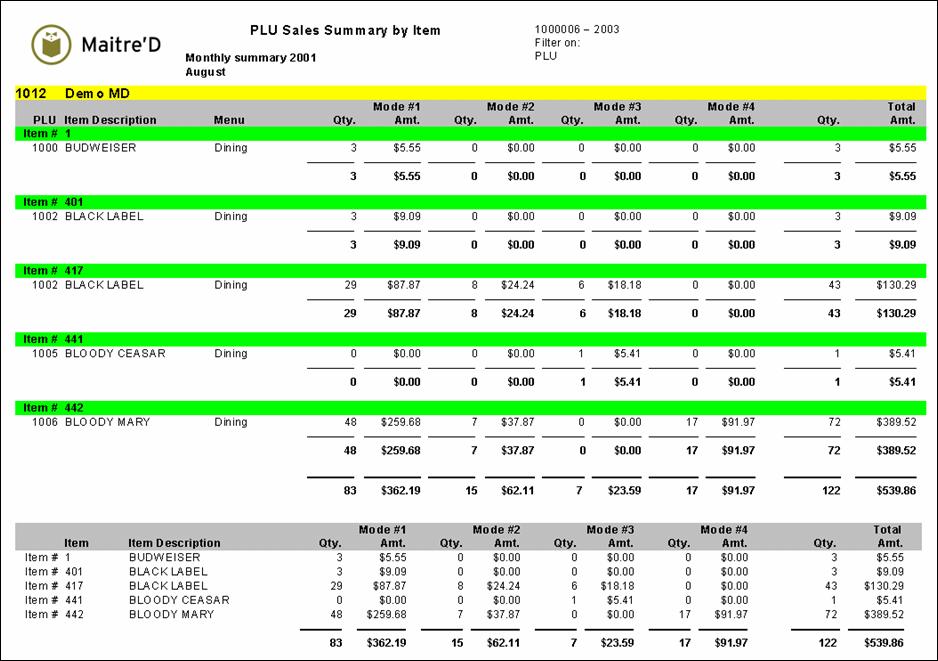
Maitre'D PLU sales summary by item report shows PLU information by sales items for the date or the period of time requested. From the report filter window, select the appropriate dates, PLUs, and sales items to be included in the report.
The following is a sample of the PLU sales summary by item report:
This report is divided in two sections. For each sales item number, from P.O.S. Control, the first three columns of the first section provide you with:
Item #
Code of the PLU.
Item description
Description of the PLU.
Revenue Center
Description of the Revenue Center.
For each sales item, the next eight columns of the first section provide you with:
Qty.
Quantity of PLU sold in each mode, by PLU and total for all PLUs.
Amt.
Value of PLU sold in each mode, by PLU and total for all PLUs.
For each sales items, the last two columns of the first section provide you with:
Qty.
Quantity of PLU sold in all modes, by PLU and total for all PLUs.
Amt.
Value of PLU sold in all modes, by PLU and total for all PLUs.
For each sales item, the first two columns of the second section provide you with:
Item #
Code of the sales item in P.O.S. Control.
Item description
Description of the sales item.
For each Revenue Center, the next eight columns of the second section provide you with:
Qty.
Quantity of sales item sold in each mode, by sales item and total for all sales items.
Amt.
Value of sales items sold in each mode, by sales item and total for all sales items.
For each Revenue Center, the last two columns of the second section provide you with:
Qty.
Quantity of sales item sold in all modes, by sales item and total for all sales items.
Amt.
Value of sales items sold in all modes, by sales item and total for all sales items.
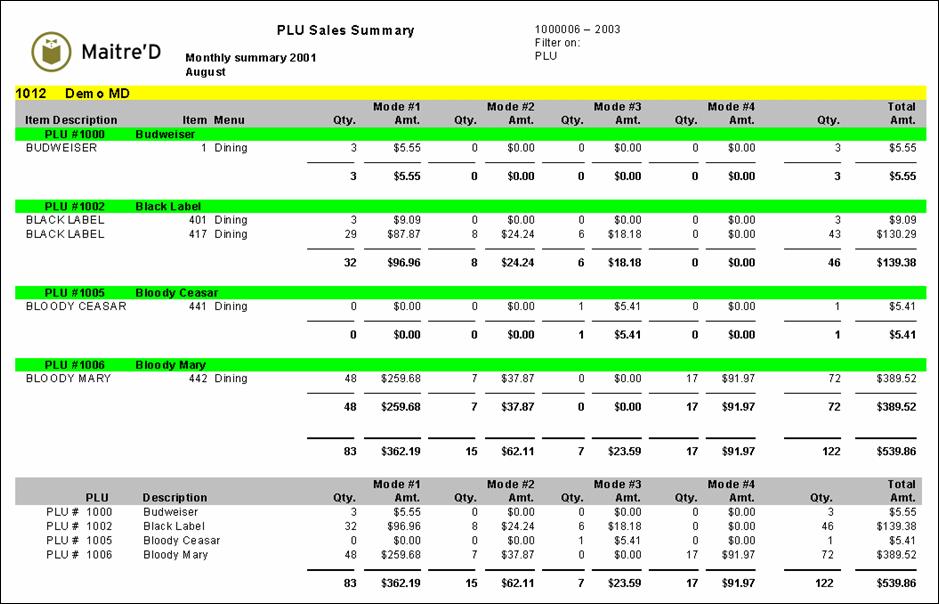
Maitre'D PLU sales summary report shows PLU information for the date or the period of time requested. From the report filter window, select the appropriate dates, PLUs, Revenue Centers, divisions and items to be included in the report.
The following is a sample of the PLU sales summary report:
This report is divided in two sections. For each individual PLU, the first three columns of the first section provide you with:
Item description
Description of the sales item.
Item
Code of the sales item in P.O.S. Control.
Revenue Center
Revenue Center of the sales item.
For each PLU, the next eight columns of the first section provide you with:
Qty.
Quantity of sales item sold in each mode, by sales item and total for this PLU.
Amt.
Value of sales items sold in each mode, by sales item and total for this PLU.
For each PLU, the last two columns of the first section provide you with:
Qty.
Quantity of sales items sold in all modes, by sales item and total for this PLU.
Amt.
Value of sales items sold in all modes, by sales item and total for this PLU.
For each individual PLU, the first two columns of the second section provide you with:
PLU
PLU number.
Descritpion
PLU description.
For each PLU, the next eight columns of the second section provide you with:
Qty.
Quantity of PLU sold in each mode, by PLU and total for all PLUs.
Amt.
Value of PLU sold in each mode, by PLU and total for all PLUs.
For each PLU, the last two columns of the second section provide you with:
Qty.
Quantity of PLU sold in all modes, by PLU and total for all PLUs.
Amt.
Value of PLU sold in all modes, by PLU and total for all PLUs.
Maitre'D weekly summary of clients by time period report shows client count information by half-hour time slices for the week requested. From the report filter window, select the appropriate start date and time slices to be included in the report.
The following is a sample of the weekly summary of clients by time period report:
For each half-hour of each mode of each day of the week, this report shows the client count.
From-To
Beginning and end of half-hour time slice.
Sun to Sat
Sunday through Saturday.
Total
Total clients of that half-hour slice for the week.
Mode
Total clients for that mode on that day and for the whole week.
Total
Total clients of that day.
Maitre'D weekly summary of meals by time period report shows meal count information by half-hour time slices for the week requested. From the report filter window, select the appropriate start date and time slices to be included in the report.
The following is a sample of the weekly summary of meals by time period report:
For each half-hour of each mode of each day of the week, this report shows the meal count.
From-To
Beginning and end of half-hour time slice.
Sun to Sat
Sunday through Saturday.
Total
Total meals of that half-hour slice for the week.
Mode
Total meals for that mode on that day and for the whole week.
Total
Total meals of that day.
Maitre'D order report provides all items ordered for a specific time frame. From the report filter window, select the date and time range, tables and employees to be included in the report. If you select the current day, as a date range, Maitre'D shows orders from printed checks. The following is a sample of the order report:
Time:
The time that the item was ordered at the workstation
Id Employee:
Pos Control employee code
Employee:
POS Control employee name
Table:
Table #
Id Item:
Item #
Item:
Item description
Quantity:
Quantity sold, if a negative quantity, the item was voided
Price:
The price of the item
Mode:
Order mode according to the time of the day and/or employee screen access
Revenue Center:
The Revenue Center the item was ordered from
Check#:
The check number the item belongs to
Train.:
Has a check mark when an employee (under training) orders the item.
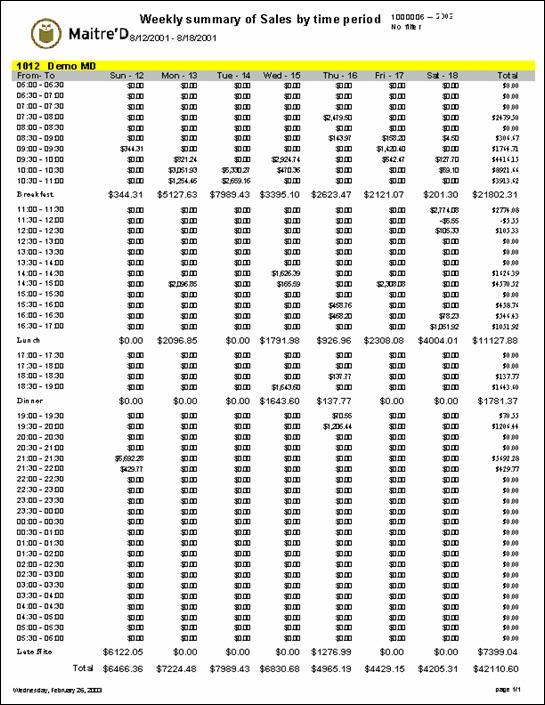
Maitre'D weekly summary of sales by time period report shows sales information by half-hour time slices for the week requested. From the report filter window, select the appropriate start date and time slices to be included in the report.
The following is a sample of the weekly summary of sales by time period report:
For each half-hour of each mode of each day of the week, this report shows the sales.
From-To
Beginning and end of half-hour time slice.
Sun to Sat
Sunday through Saturday.
Total
Total sales of that half-hour slice for the week.
Mode
Total sales for that mode on that day and for the whole week.
Total
Total sales of that day.
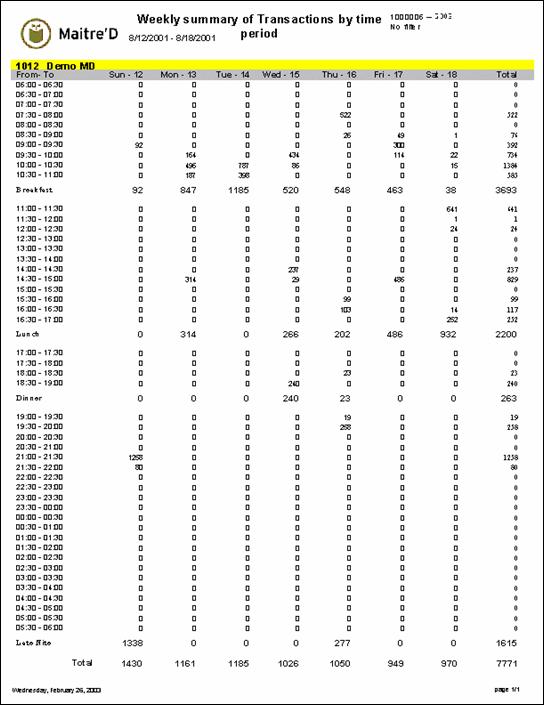
Maitre'D weekly summary of transactions by time period report shows transaction count information by half-hour time slices for the week requested. From the report filter window, select the appropriate start date and time slices to be included in the report.
The following is a sample of the weekly summary of transactions by time period report:
For each half-hour of each mode of each day of the week, this report shows the transaction count.
From-To
Beginning and end of half-hour time slice.
Sun to Sat
Sunday through Saturday.
Total
Total transactions of that half-hour slice for the week.
Mode
Total transactions for that mode on that day and for the whole week.
Total
Total transactions of that day.
Maitre'D price override report provides all items ordered for a specific time frame. From the report filter window, select the date and time range, tables and employees to be included in the report. The following is a sample of the price override report:
Time:
The time that the item was ordered at the workstation
Id Employee:
Pos Control employee code
Employee:
POS Control employee name
Table:
Table #
ID:
Item #
Item:
Item description
Quantity:
Quantity sold, if a negative quantity, the item was voided
Unit Price:
The price the employee applied on that item for that current order only.
Real Price:
The regular price of the item.
Mode:
Order mode according to the time of the day and/or employee screen access
Revenue Center:
The revenue center the item was ordered from
Check#:
The check number the item belongs to
Train.:
Has a check mark when an employee (under training) orders the item.
Maitre'D Summary of Servers report shows you concisely sales by employees.
From the report filter window, select the dates and employees to be included in the report.
The following is a sample of the summary of servers report:
For each server, one line of the Summary of Servers report provides you with:
#
Employee number.
Server
Name of the Employee.
Total
Total sales including service charges and taxes, minus discounts.
Transfer
Sales and discounts transferred from other employees or managers.
Sales
Total sales before service charges, taxes and discounts.
Discount
Discounts applied by this employee.
Tax
Taxes applied on taxable sales.
Service
Service charges applied for this employee.
Voids
Value of voids applied for this employee.
No sales
Number of times the cash drawer was opened without sales by this employee.
Customer
Number of customers served by this employee.
Report
Hour when the reading was printed by this employee.
Begin
Time of first item ordered by this employee.
End
Time the last invoice was printed by this employee.
Maitre'D Summary of Payment by Servers report shows you media types per employee.
From the report filter window, select the dates and employees to be included in the report.
The following is a sample of the summary of payments by servers report:
For each employee, a section of the Summary of Payments by Servers report provides you with:
#
Employee number.
Server
Name of the employee.
Description
Name of the Media Type.
Qty
Number of times this Media Type was used by this employee.
Amount
Total amount of sales settled with this media type by this employee.
Net Deposit
Total of all Media Types for this employee.
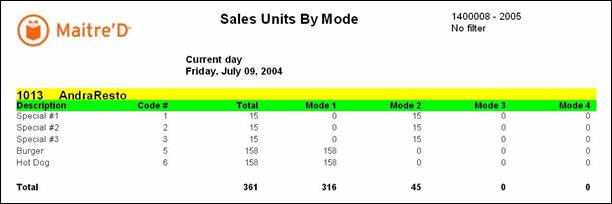
The following is a sample of the Sales Units By Mode report
Maitre'D Sales Consolidated with Discounts by Categories report shows the restaurant's sales and discount information.
From the report filter window, select the dates to be included in the report.
The following is a sample of the sales consolidated with discounts by categories report:
The report is divided in 6 sections.
The first section provides you with:
Total net sales
Sales after all discounted $ amounts, and before taxes.
Total taxes
Total of all taxes charged to the customers.
Total discounts
Total of all discounts applied during the day.
Total Sales
Total gross sales = total net sales + total taxes.
Service
Total service charge.
# Meal(s)
Total number of meal served.
# Client(s)
Total client served.
# Table(s
Total number of tables served.
No sale(s)
The number of times the cash drawer was opened without any sales being done.
Meal value
Total $ value for all meals served.
Average / Client
An average $ amount by clients.
Average / table
An average $ amount by tables.
Table turnover (min.)
An average of the amount of time before a table turnover occurs.
Frequent Diner(s)
Total Number of Frequent Diner served.
Reward Coupon(s)
Total Number of Reward Coupon Diner emitted
Division
This section provides you with:
#
Quantity of items sold in this division.
Description
Name of the Division.
Value
Sales value of items sold, by division and total for all divisions.
Average
Division sales divided by total sales for all divisions multiplied by 100.
Categories
This section provides you with:
#
Quantity of items sold in this division category.
Description
Name of the Division Category.
Value
Gross sales value, by category and total for all categories, before discounts.
Discount
Value of discounts applied, by category and total for all categories.
Net Discount
Net sales value, by category and total for all categories, after discounts.
Average
Gross category sales divided by gross sales for all categories multiplied by 100.
Medias
This section provides you with:
#
Number of times this payment was used.
Description
Name of the payment.
Value
Total amount of sales settled with this payment.
Total Medias
Total amount of sales settled with all payments.
Percentage
Sales settled with this media divided by Total Medias multiplied by 100.
Taxes
This section provides you with:
Description
Name of the tax.
Value
Total amount of this tax applied.
Total Taxes
Total amount of all taxes applied.
Discount
This section provides you with:
#
Number of times this discount was given.
Description
Name of the discount.
Value
Total amount of this discount given.
Total Discount
Total amount of all discounts given.
Maitre'D's No Sales reports print the number of times cash drawers were opened without a transaction. The following is a sample of the no sales by employee report:
Maitre'D hourly reports provides access to different numbers based on Time Tables. From the report filter window, select the appropriate date, time tables and hourly reports to be included in the report.
Here is an example of the sales by division hourly report:
The following is a sample of the Sales Units By Revenue Center By Mode report
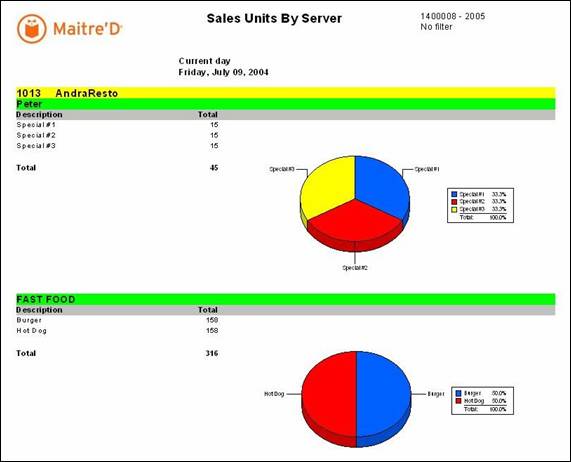
The following is a sample of the Sales Units By Server report
Sales by drawer
sales by shift
Sales by workstation
sales by table
sales consolidated
Top 15 items by mode
Top 15 items by revenue center
Top 15 items by
consolidated
DSR
Permanent
Daily permanent sales
Items reports per employee
Daybook
Taxes by revenue centers
Taxes by Modes
Sales per Division Category by Revenue Center
Sales per Division Category by Mode
Sales per Division by revenue Center
Sales Consolidated per Item and Mode by Division
PLU Sales Summary
PLU sales summary by Division
PLU Sales Summary by Revenue Center
PLU Sales Summary by Item
Weekly summaru of Clients by Time Period
Weekly summary of Meals by Time Period
Weekly summary of Transactions by Time period
Weekly summary of Sales by Time Period
Order Report
Price Override
Summary of Servers
Summary of Payment by Servers
Summary of Servers (detailed)
Sales Consolidated with Discount by Categories
Sales Units By Revenue Center By Mode
Sales Units By Mode
Sale Units By server
Hourly Report
No Sales

